Data import/export
To import rectilinear or raw MSI data, or histopathology images, navigate to the Data tab.
Import MSI Data
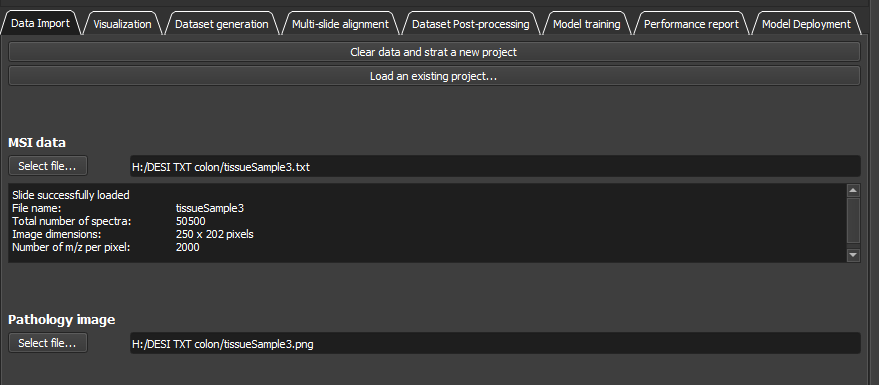
Click ‘Select file…’ under MSI data. A file dialog box will open, allowing you to browse and select the file. MassVision supports different formats including:
Modality-independent structured MSI files (.csv)
Modality-independent hierarchical HDF5 files (.h5)
DESI MSI image files from Waters (.txt)
Select the format from the dropdown menu, select the file, and click ‘Open’ to load the data.
Note
The instruction on how to structure your MSI data into CSV or HDF5 compatible with MassVision can be found in Data Structure page.
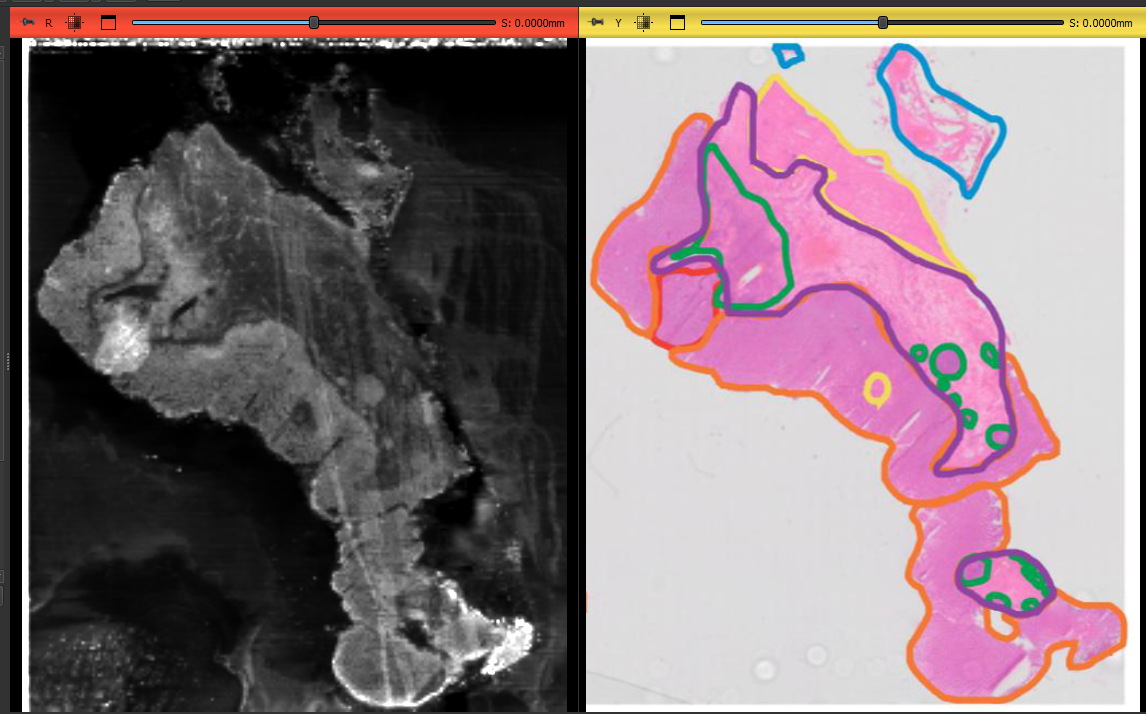
After the data is loaded, general information like number of pixels, number of ions, and the name and location of the file will appears in the text box. The TIC visualization will also be displayed in the viewer. To adjust the image’s contrast, click the
 icon in the Slicer toolbar at the top of the screen. You can adjust the contrast by left-click-and-drag on the image or by selecting a region.
Import Reference Image
To load a gold-standard image like histopathology annotations, click ‘Select file…’ under Reference Image. A file dialog box will appear, allowing you to upload the desired image.
Raw MSI
MassVision can be used for processing and exploring raw MSI data in imzML format.
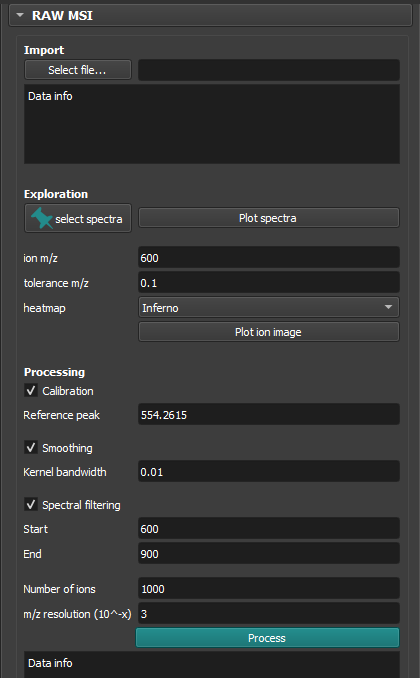
Import Data
- Select file…
Click this button to load your raw imzML MSI data. After successful loading, the TIC (total ion current) image will appear in the view panel.
- Data info
After loading a file, metadata will be displayed here, including spatial dimensions, number of spectra, m/z range, etc.
Spectrum Plot
- Select spectra
Use this button to place a fiducial marker on the TIC view of the MSI data. You can interactively change its position with the mouse. Multiple fiducials can be placed to inspect spectra from multiple pixels.
- Plot spectra
Displays spectra for all interactively selected points in a plot for inspection.
Ion Image Plot
- ion m/z
Enter the central ion of interest to be plotted.
- tolerance m/z
Define the mass tolerance window around the ion of interest.
- heatmap
Choose the colormap for ion image visualization.
- Plot ion image
Generates an ion intensity heatmap across the tissue/sample at the specified range.
Peak Picking
- Calibration
If enabled, performs lock-mass calibration on each pixel spectrum using the m/z defined in Reference peak (e.g.,
554.2615).- Smoothing
If enabled, applies smoothing to spectra to reduce noise. The degree of smoothing can be adjusted via Kernel bandwidth:
Smaller = less smoothing (more detail preserved)
Larger = more smoothing (reduces noise, but may blur peaks)
- Spectral filtering
If enabled, restricts spectra to the user-defined m/z window specified in Start / End (e.g.,
600–900).- Number of ions
Sets the maximum number of ions to extract. Peak picking is based on the summed abundance across all pixels.
- m/z resolution
Sets the decimal precision of the m/z values. Example: ``3`` → 0.001 m/z resolution
- Process
Executes all selected processing steps (calibration, smoothing, filtering) to produce a rectilinear (cubical) dataset with a unified m/z list across all pixels.