Visualization
MassVIsion supports different approaches including targeted visualizations, global and local contrast visualizations, nonlinear visualizations, visualization segmentation, and pixel spectrum plot.
Targeted Visualizations
Single-ion heatmap
Under ‘Targeted single-ion’ select the m/z value of interest from the ‘Ion Image’ dropdown, or type the m/z value while on the list to find and select the ion. Select a heatmap option and push ‘Visualize’ to see the single-ion image on the viewer.
Most abundant ions
In ‘Targeted single-ion’ section, click on Thumbnail view to see a grid image of TIC and top ion images with highest overall intensity across the slide.

Multi-ion visualization
Under ‘Targeted multi-ion’ select multiple m/z values associated with different color channels using a similar instruction for single-ion. MassVision supports overlaying up to 7 ion images using distinct color scales. Push ‘Visualize’ to see the result in the viewer.
Untargeted Multivariate
These approaches leverage all ions and apply Principal Component Analysis (PCA) to generate color representations of the MSI data. The visualization is created by concatenating the first three principal components as the red, green, and blue channels of an RGB image.
Global-contrast
Select ‘Global Contrast (PCA)’ to create a PCA visualization based on all the pixels in the MSI data.
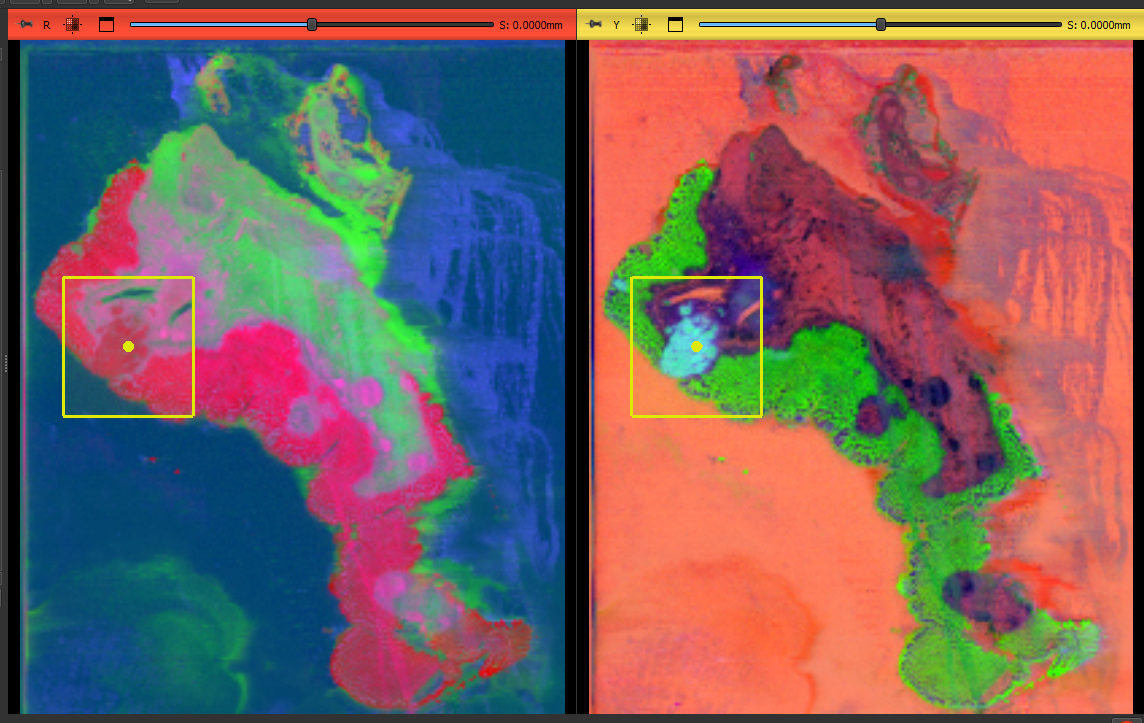
Local-contrast
Use this visualization to emphasize the local metabolomic changes by recalculating the PCA specifically for a spatial region of interest (ROI) defined by the user.
CLick on Select region button to activate interactive rectangular region selection. Use the mouse cursor on the PCA image and create a bounding box by left-click-and-drag. The dimensions of the box can be adjusted by dragging the dots on the box’s perimeter. Its location can be adjusted by clicking on the center dot and dragging the box. Right-clicking on the box will show you other available actions in 3D SLicer.
The current version of MassVision supports single contrast region and you cannot have more than one bounding box. Clicking on Select region again will delete the previous box and allow users to draw a new one.
Note
If you edit the ROI via right-click, you may be directed to the 3D Slicer Markups module. Navigate back to the MassVision module by clicking the magnifying glass beside ‘Modules’, and search for MassVision, or use the green arrows beside the ‘Modules’ to go to previous modules.
After the region is specified, click on ‘Local Contrast (PCA)’ to see generate the visualization for the region. To apply the calculated local PCA to the whole image, check ‘Extend to whole slide’.
Tip
For all the visualizations, users can adjust the brightness and contrast of the image by selecting the ‘Adjust Window/Level’ icon  in the 3D Slicer toolbar at the top of the screen. You can adjust the contrast by left-click-and-drag on the image or by selecting a region on it.
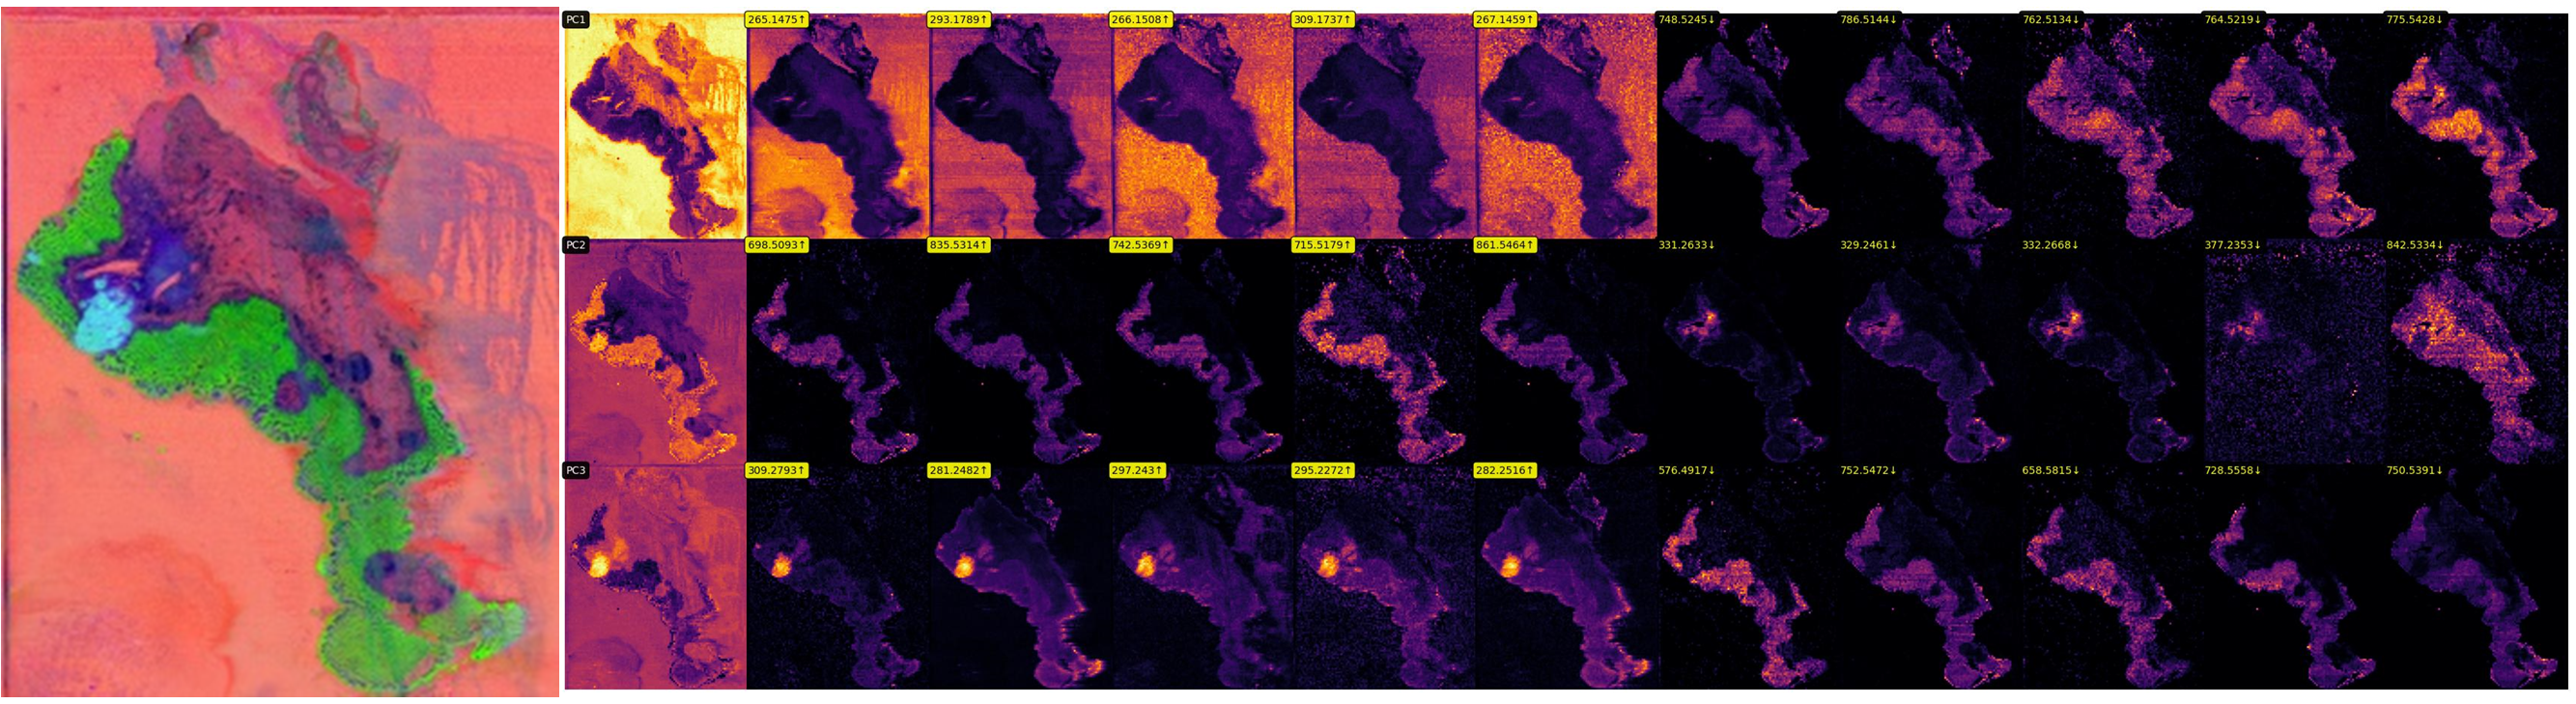
Contrast dominant ions
Under ‘Untargeted multivariate’ section click on Thumbnail view to see a grid image of individual PC images and top ion images with highest positive and negative loadings. These ion images are considered to be most dominant in creating the final untargeted visualization. The thumbnail view works for all global, local, and ROI contrast images.
Contrast clustering
After generating local or global contrast images, users can run K-means clustering on these visualizations to cluster the pixels. Users can compare each cluster with ion images and find ions with highest spatial co-localization with the cluster. This is useful for spatially validated ion identification.
Clustering
After generating your untargeted visualization, select the number of clusters using the dropdown menu and click Cluster. The view will display the clustering results as a label map image, where pixels belonging to the same cluster are assigned the same color, distinct from the colors of pixels in other clusters.
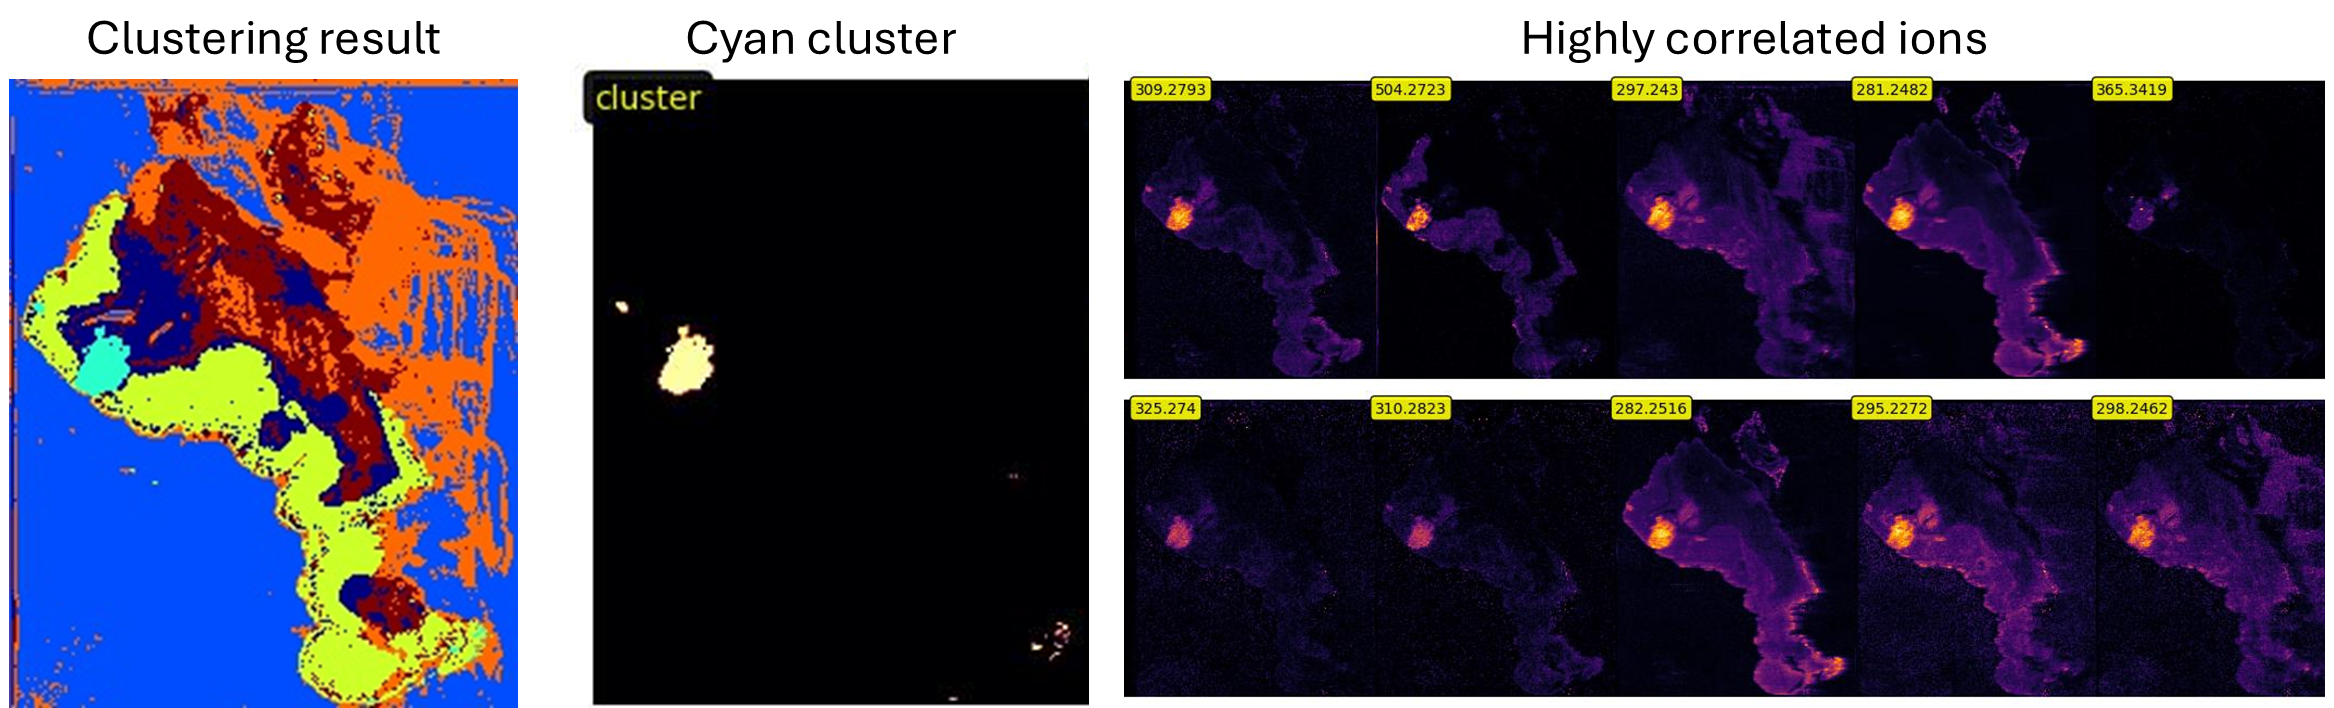
Cluster dominant ions
After clustering, select a specific cluster from the dropdown menu, which is color-coded to match the cluster image for convenience. Click on Thumbnail view to display a grid image of selected cluster and highly correlated ion images with that cluster. While the ranking is based on Pearson corelation coefficient, other measures like fold change, p-value of T-test, and Dice score between the cluster and highly correlated ion images are also reported in a table under ‘Cluster dominant ions’.
Nonlinear visualization
MassVision supports non-linear dimensionality reduction approaches including t-SNE and UMAP. Users can select the Method from the dropdown menu and adjust the relevant parameters fpr visualization.
t-SNE parameters: perplexity and early exaggeration
UMAP parameters: number of neighbors and minimum distance
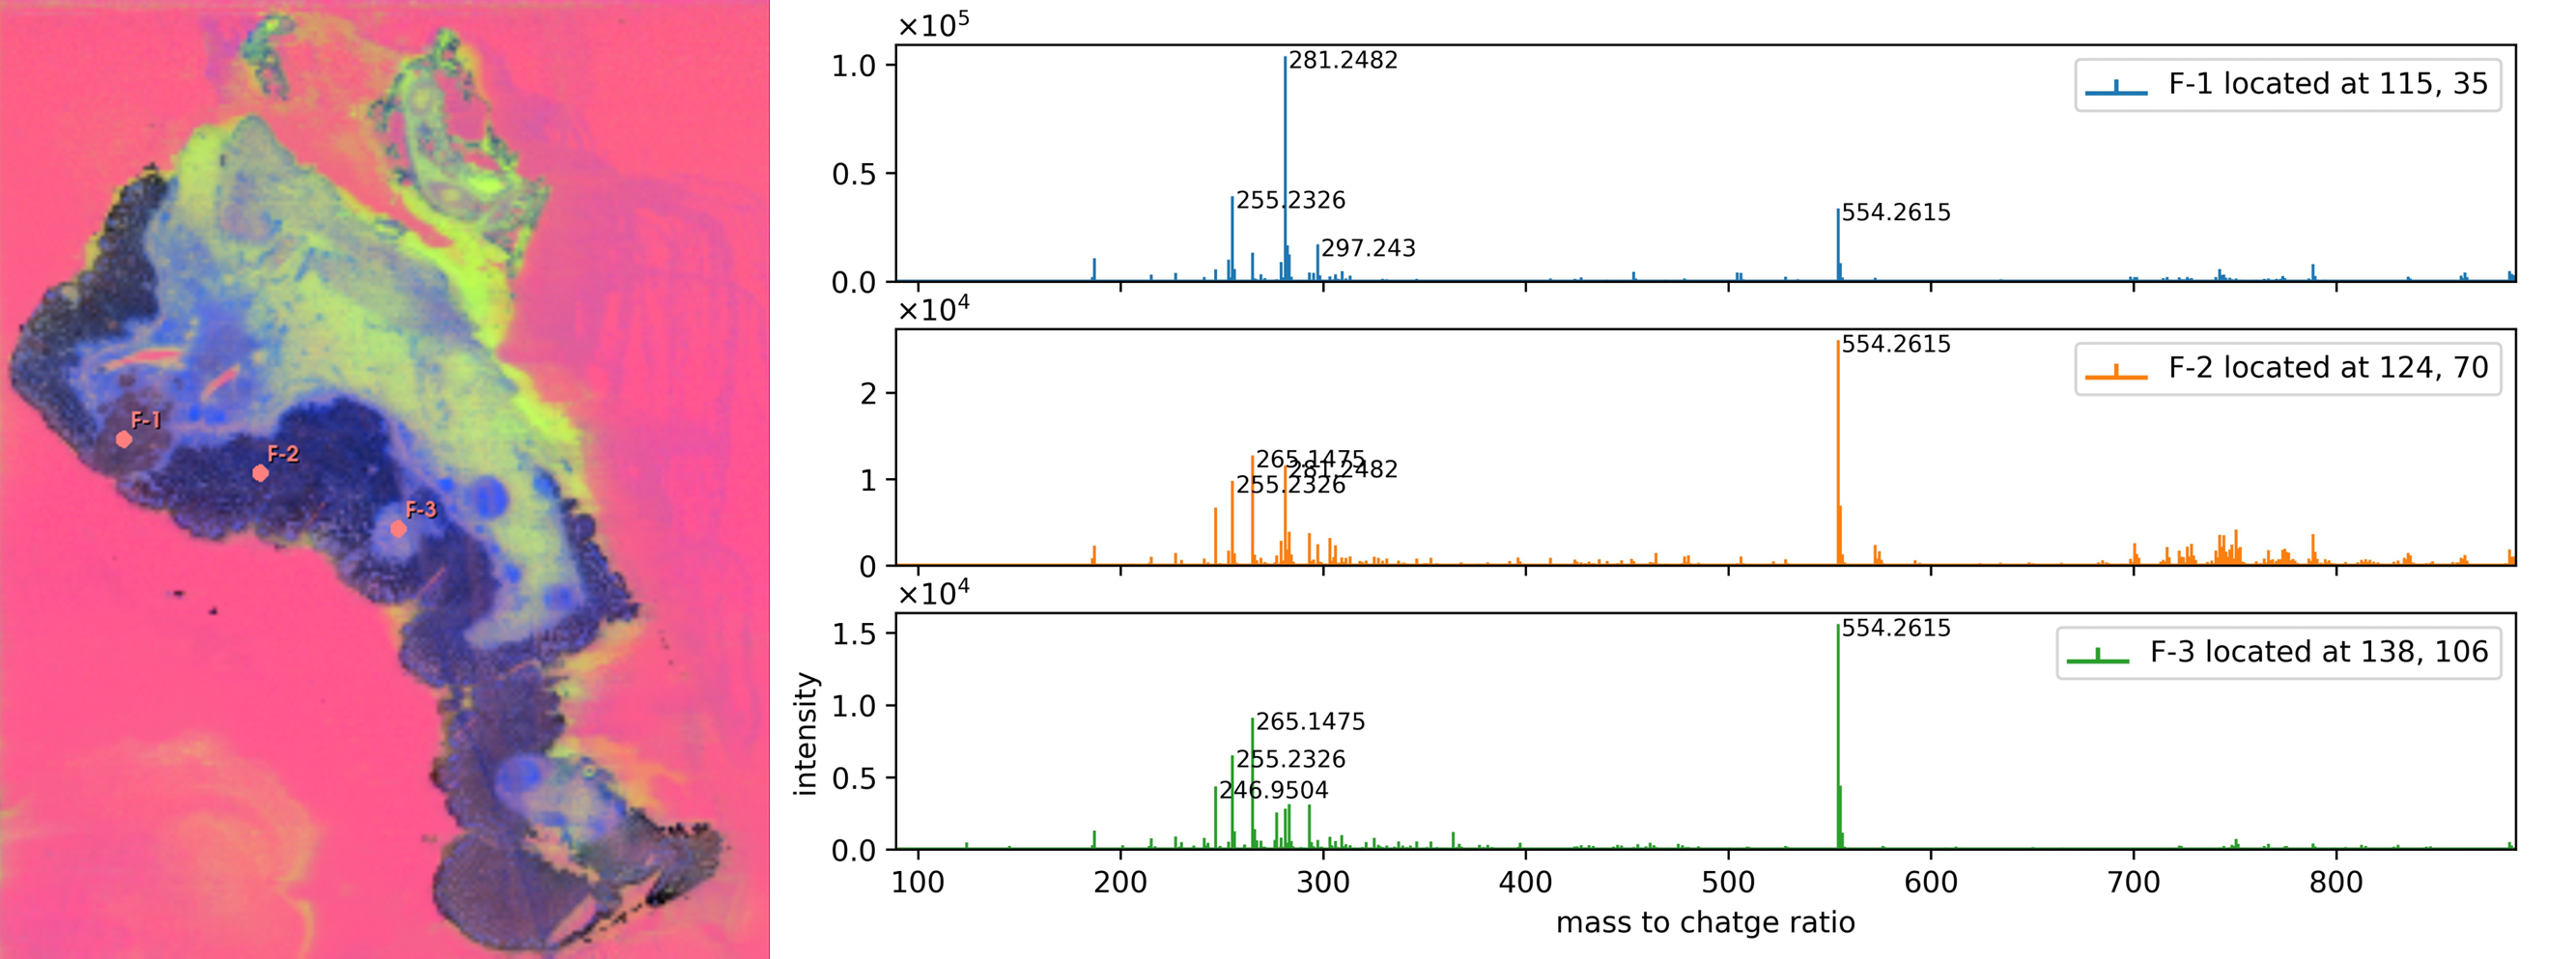
Pixel Spectrum
To plot the mass spectra associated with specific pixels, users should first identify the pixels of interest by placing fiducials at their locations on the viewer. Any visualization can be used for guiding the mass spectrum plot.
Click the select spectra button in the pixel spectrum section.
Click on the desired location on the image to place a marker.
You can interactively change the location of the fiducial with the mouse.
To add more fiducials, click on select spectra again and then select the location of interest on the image.
There is no limit to the number of fiducials, allowing you to add as many as needed.
To delete or rename a fiducial, right-click on it to view available options.
Once you are satisfied with the list of markers, click Spectrum Plot. A second viewer will display a plot for each selected pixel next to the visualization image.
The plots are interactive for move and zoom.
Clicking on specific peak on each spectrum will visualize the associated ion image.